One of the Image Correction Algorithm of QR Code
and Its Implementation Based on Wavelet Transform
1.Chun Jin
[1]School of Communication and Information Engineering,
Chongqing University of Posts and Telecommunications,
Chongqing, 400065 China
[2]Chongqing Jinou Science & Technology Co., LTD
Chongqing, 400041 China
2.Jianghong Yuan
School of Communication and Information Engineering,
Chongqing University of Posts and Telecommunications,
Chongqing, 400065 China,
yuanjianghong2@163.com
3.Eryang Chen
[1]School of Automation Engineering ,
University of Electronic Science and Technology of
China,Chengdu, 611731 China
[2]School of Electronic Information and Engineering,
Chengdu University,
Chengdu, 610106 China
4.Leilei Li
Chongqing Broadcasting & TV Group ,
Chongqing, 400039 China
5.Gang Han
Chongqing Guangtong Industry Co., LTD
Chongqing, 400039 China
6.Tao Tang
Jiangbei Power Supply Bureau of Chongqing Electric Power
Company,
Chongqing, 401147 China
I. INTRODUCTION[1]
Barcode technology is
an important part of automatic recognition and data
collection technology, which includes coding, symbolic
representation, printing, recognition, data acquisition
and processing. One-dimensional barcode has been widely
used in many fields such as transportation industry,
business, manufacturing, ware-housing and etc. Its
principle is using optoelectronic scanning devices to scan
barcode and get a group of reflected light signals which
is converted into electronic signals after photoelectric
translating. The corresponding number is obtained by
decoding electronic signals. And then the corresponding
information can be inquired through the computer which is
linked together the database on the background server. In
this way, the barcode is recognized. At present,
one-dimensional barcode technology has been matured, which
improves the speed of data collection and information
processing and in the meantime, generally boosts working
efficiency. This technology has formed onedimensional
barcode automatically data acquisition technology which is
of high reliability, low cost, high speed and wide
application. But the traditional one-dimensional barcode
has some limits such as low information density, small
information capacity, no ability in error correction and
relying on database [2]. Two-dimensional barcode began to
appear in the early 1990s. It is characterized as high
information density, high information capacity, great
ability in error correction, independent of the database
and etc. As one of the twodimensional barcodes, QR code
can do better coding processing to Chinese characters and
image information. Besides, it has common advantages with
other commonly used two-dimensional barcodes. QR code has
advantages such as ultra-high speed read, all-round
recognition and etc. Figure 1 shows that the application
fields of QR code are very wide.
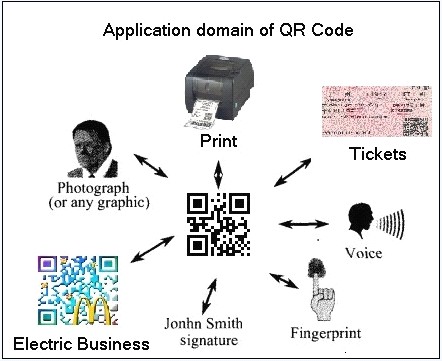
Figure 1 QR Code Application Domain Chart
In
real life, when we use the camera equipment (such as
computer camera, cell phones and etc) to acquire QR code
image, the generated QR code image may have geometric
distortion (such as trapezoid distortion,diamond
distortion and etc) which is caused by acquisition angle
deviation or object image itself being not in the same
plane. Although Hough transform can correct the tilt angle
of the image and the effect is good, it can't do anything
with the geometric distortion. To solve the above
problems, this paper puts forward a QR code edge detection
algorithm which is based on wavelet transform. Four image
distortion control points of the QR code are determined by
the algorithm. Then the distortion QR code image can be
corrected by using projection transformation of the
geometrical flat. Finally, the QR code image is restored
through the double linear interpolation algorithm. This
method can effectively solve geometric distortion of the
QR code image.
II. THE STRUCTURE ANALYSIS OF THE QR CODE
QR code symbol is a
square array composed of each module which consists of a
coding region and a function graphic region. Coding area
includes format information, version format, data, error
correction coding [2] and etc. And the function graphic
region is made up of position detection graphics,
positioning graphics, calibration graphics and etc. There
are three position detection graphics which is used to
localize image quickly in QR Code image. They are
distributed on the top left corner, on the top right
corner and at the bottom left corner of the QR code.
Figure 2 is the structure chart of the QR code symbols.
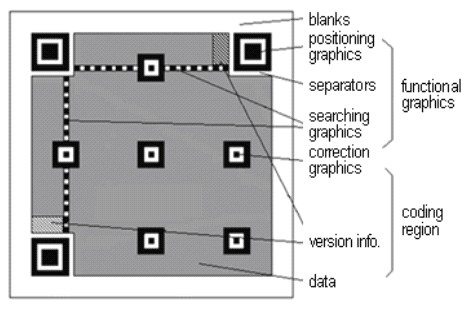
Figure 2 QR Code Symbol Chart
III. IMAGE EDGE DETECTION ALGORITHM OF QRCODE
The so-called edge
detection is to portray the edge of the image and fill the
non-edge region with contrasting colors. The purpose of
the image edge detection is to reduce the amount of data
and eliminate irrelevant information, retaining the image
of the important structural properties. There are several
usual edge detection operators, such as Prewitt operator,
Sobel operator, Canny operator, etc. And Canny edge
detection operator is the most perfect one in theory
currently. Canny operator can achieve good interference
rejection, and it can generate the gradient direction and
strength of the edge for subsequent processing. But the
Canny operator is not yet perfect. To get a better edge
detection results, it usually requires using a larger
filter scale[3], and this make it easy to lose some of the
details. This paper will present a kind of edge detection
algorithm based on wavelet transform, it can not only
identify an important feature in the image, but also
construct a description of the image with varied level of
detail.
A. The Principle of Two-dimensional Image Edge Detection
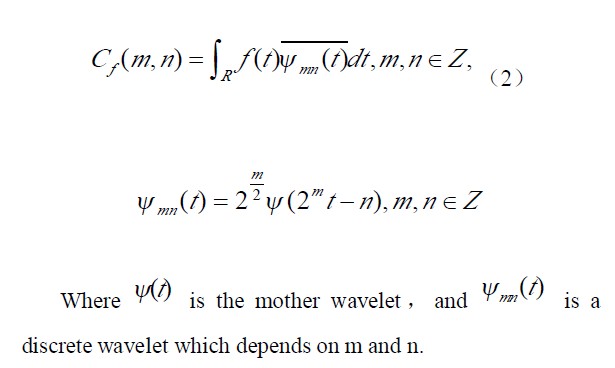
1) The theory of wavelet transform [4]
Continuous wavelet
transform (CWT) is defined as:
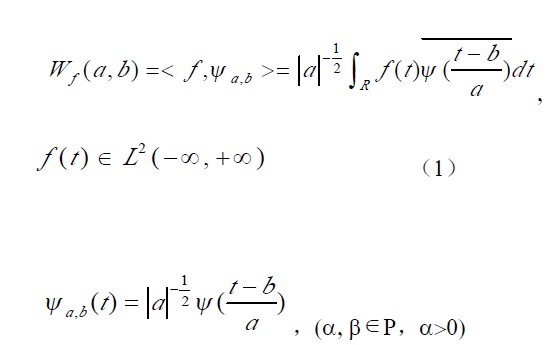
Figure 2 QR Code Symbol Chart
Where a and b are scale and translation parameters
respectively, and ,
 is a continuous wavelet which depends on a and b.
Discrete wavelet transform (DWT) is defined as:
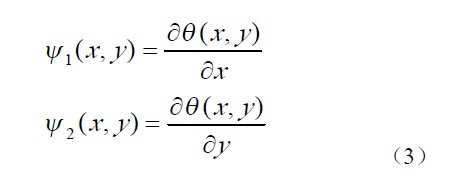
2) The principle of edge detection
We called θ( x , y) is
a two-dimensional smooth function, whose first partial
derivative along the x and y directions are shown in
formula (3). And we choose them as wavelet functions.
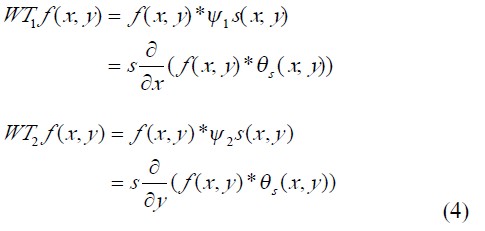
The
two-dimensional function f (x, y) represents the image
data, whose wavelet transform in both directions x and y
for scale s are as follows:
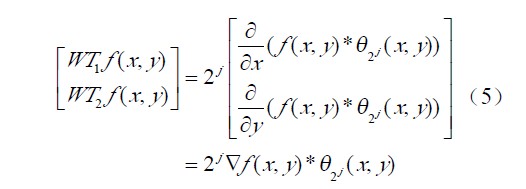
Scale
s in formula (4) is usually taken by 2j in represent of
the binary wavelet.Therefore,formula (4) is denoted by
vector form as follows:
Then
we can figure out the gradient vector modulus and argument
using the following formulas
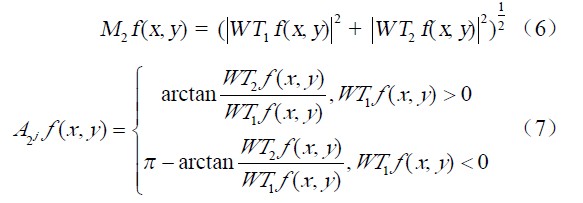
The
above discussion shows that the wavelet transform of f(x,
y)about ψ1(x)and ψ2 (x) has great theory significance and
utility value. After wavelet decomposition of a image, the
local maximum of the wavelet vector modulus is
corresponding to the singularity of in the resolution for
the 2j of the image, namely edge. In particular,the
direction of wavelet vector is nearly perpendicular to the
direction of the edge tangent.
B. Edge Detection Method Based on Wavelet Transform
The main steps of the
proposed edge detection method based on wavelet transform
is as follows: ① Firstly,making a smooth noise reduction
processing to the being detected image,then we obtain
image G'; ② Secondly, multi-level wavelet transform is
done to image G', from which we can obtain the wavelet
transform coefficient at all levels;③ Thirdly, we can
obtain the local maximum value of the wavelet transform
coefficients at all levels and the edge at different
resolution;④ Finally, integrating the edge at all levels,
then refining the edge.
1) Multiscale edge detection
Noises have great
influence on image edge detection. So we should reduce the
noise of the noisy image before edge detection. What's
more, wavelet denoising technology takes full advantage of
the characteristics of multi-resolution analysis of
wavelet transform to denoise the image. Research shows
that it is a simple calculation and relatively ideal
method for denoising, which can not only improve the noise
ratio of signals, but also can retain the information of
signal mutation.
Multiscale edge
detection is to say multistage wavelet decomposition of
denoised images,from which the approximate images , level
high frequency images,vertical high frequency images and
opposite angles high frequency images of different
resolution and wavelet coefficient at all levels can be
got.
2) Refinement edge
After multiscale edge
detection, most of noises have been effectively suppressed
in the noisy image, but the edge is fairly rough. So in
the next step we should remove the fake edges and isolate
the edge points to get the edge of single pixel.
A refinement of the
edge of the method is simple and edge detection results
are satisfactory. Its main steps are as follows: For one
thing, Prewitt operator[5] with the attenuation divisor is
used to refine the edge of image E1 (x, y), then we can
get the edge image E2 (x, y). For another thing, we have
to change the negative value corresponding edge points to
zero of the result that image E1 (x, y) subtract image E2,
(x, y) , and we obtain image E3 (x, y) which has been
refined.
3) The algorithm verification using matlab
A part of program code of matlab simulation is as follows:
clear all;
close all; clc
f = imread('E:\yuanjh\cqupt.jpg');
I=rgb2gray(im2double(f));
imshow(I);
I1=imadjust(I,stretchlim(I),[0,1]);figure;imshow(I1);
[N,M] = size(I);
h = [0.125,0.375,0.375,0.125];
a(:,:,1,1) = conv2(h,h,I,'same');
d(:,:,1,1) = sqrt(x.^2+y.^2);
I1=imadjust(d(:,:,1,1),stretchlim(d(:,:,1,1)),[0
1]);figure;imshow(I1);
j = 1:J+1
lhj = 2^j*(lh-1)+1;
hj(1:lhj)=0;
a(:,:,1,j+1) = conv2(hj,hj,a(:,:,1,j),'same');
dj(:,:,1,j+1) = sqrt(x.^2+y.^2);
I1=imadjust(dj(:,:,1,j+1),stretchlim(dj(:,:,1,j+1)),[0
1]);figure;imshow(I1);
Figure 3 shows the wirkungbild after the abovementioned
edge detection algorithm:

(a) Original Figure
(b)Wirkungbild after Edge-Detection
Figure 3 Based on Wavelet Transform Edge-Detection Chart
Compared
with several other edge detection algorithm, the algorithm
not only achieves good edge detection, but also simplifies
a lot of computing and effectively reduces the noise.
IV. SOFTWARE IMPLEMENTATION OF THE IMPROVED ALGORITHM
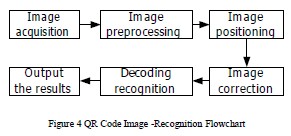
A. Image Recognition of QR Code
Image Recognition of
QR Code is a whole process which will make a collection,
treatment, decoding and output for the QR image. The core
process of this subsection mainly includes two parts which
are image preprocessing and decoding of QR Code. As the
collected QR image is colorful, before decoding it needs
image preprocessing which includes gray-scale processing,
the median filter, binarization processing, positioning,
rotation, distortion correction and recovery of the QR
image[6]. And decoding which is the inverse process of
encoding, is to get the contained information in the QR
Code. Figure 4 presents the steps of the procedure of
image recognition of QR Code.
B. Geometric Distortion Correction for QR Code Image
For a variety of
causes, the QR Code image may represent the shape of
trapezoid, diamond, etc. And the process of geometric
distortion correction for QR Code image is to get it to
the right state. It could be used to improve the
recognition rate of the QR Code. The specific steps are as
follows:
Step 1: Gray-scale
processing. It is used to reduce the amount of data
processing.
Step 2: The median
filter. It helps to filter out extraneous noise.
Step 3: Binarization
processing. The common approaches are as follows: the
curved surface fitting algorithm, OSTU algorithm, adaptive
brightness equalization method[7], etc. We select adaptive
brightness equalization method in this paper, because it
can effectively solve the QR code image segmentation
problem with the uneven lighting conditions, and it is
more suitable for QR code image processing in a variety of
complex circumstances.
Step 4: Image
positioning. There are three Finder Pattern s located at
the corners(left-up, right-up, left-bottom) of QR Code
Symbol. No matter how QR Code turns, Finder Pattern always
follows 1:1:3:1:1 ratio, and the three Finder Pattern can
determine the angle of rotation[8].
Step 5: Angle rotation
correction according to the angle from step 4, with edge
detection algorithm based on wavelet transform.
Step 6: Geometric
distortion correction, such as correcting trapezoidal or
diamond QR Code image.
C. Results and Analyses
To verify the validity
of related arithmetic raised in this paper, based on
national standard GBT 18284-2000 and Edge Detection
Algorithm raised, we design and realize a set of software
a two-dimensional barcode recognition software. We collect
QR barcode information from the up, down, left, right
sides using the camera, and correct it with the method
raised. The experiment result is shown in Figure 5.
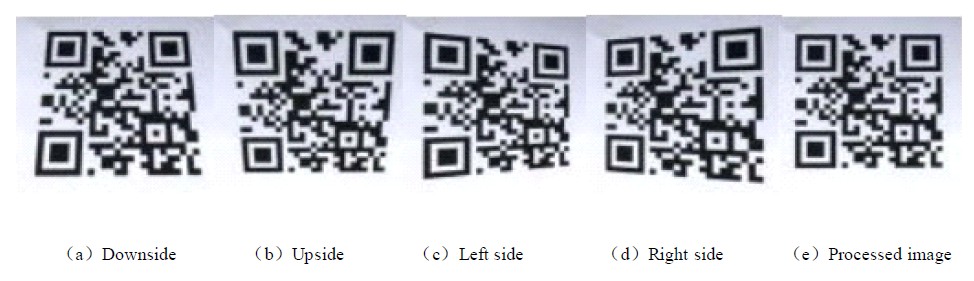
Figure 5 Trapezoidal Distortion Image-Correction Chart
Figure 6 shows a QR Code image in the shape of diamond,
and the software implementation of the improved algorithm
is shown in Figure 7. It shows that the content of the QR
Code image is: Welcome to Chongqing University of Posts
and Telecommunications!
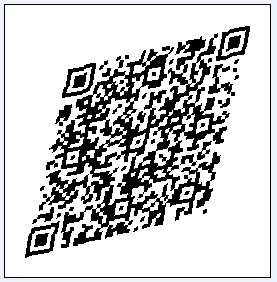
Figure 6 A QR Code Image in the Shape of Diamond
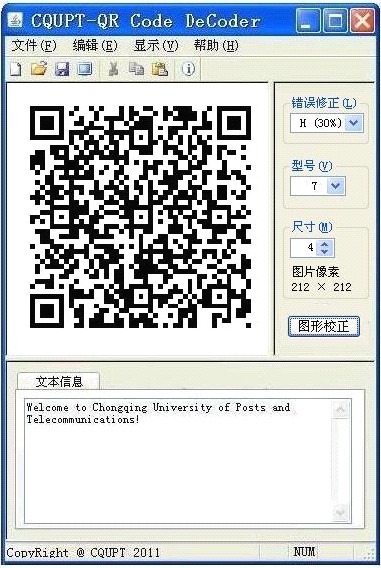
Figure 7 The Software Implementation of the Improved
Algorithm
In the above experiment shows that, the geometric
distortion correction method raised in this paper is
available. Within a certain range of distortion, it can
effectively restore the distorted QR Code image. With the
improved algorithm raised in this paper, we can decode
the distorted QR Code image more quickly and accurately.
V. CONCLUSIONS
QR code edge
detection is the key step in QR code image correction.
Efficient edge detection method can greatly reduce the
amount of data and eliminate irrelevant information,
keeping the important structure properties in the image.
The algorithm in the paper makes full use of the
characteristics of multi-resolution analysis algorithm,
it could accurately identify QR code images which have
geometric distortion of different degrees. The research
in this paper is to ensure the correctness of the
decoding of the barcode. In addition, it improves the
two-dimensional barcode identification ability and rate
of the reading software.
ACKNOWLEDGEMENT
This work is
supported by the Innovation Fund Project of China
(Project ID: 11C26215113536) . REFERENCES
[1] Jen-Yu Shieh,
Jia-Long Zhang, Yu-Ching Liao, Chih-Ming Lin , 2011 , "
Enhancing the Recognition Rate of Two-Dimensional
Barcodes Image and Applications " , 4th International
Congress on Image and Signal
Processing(CISP),pp.1567-1571, Taiwan
[2] GS1
China,National standard of QR:GBT 18284-2000
[3]
Y.-H. Chang, C.-H. Chu, and M.-S. Chen., 2007,"A General
Scheme for Extracting QR Code from a non-uniform
background in Camera Phones and Applications " , Ninth
IEEE International Symposium on Multimedia ,pp.123-130,
Taichung ,Taiwan
[4] Qian-Qing Qin,Zong-Kai
Yang,Practical Wavelet Analysis [M], Xi'an:Xi'an
University of Electronic Science and Technology
press,1994
[5] Pei-Zhuo Lv,Xiao-Zheng
Lai,Sheng-Li Lai,2008 , " Location Algorithm of PDF417
Based on Wavelet Multi-resolution Analysis", Acta
Automatica Sinica,pp.597-600,Guangdong
[6] Yuji
Kato, Daisuke Deguchi, Tomokazu Takahashi, Ichiro Ide
and Hiroshi Murase,2011 , " Low resolution QR-code
recognition by applying super-resolution using the
property of QR-codes " , International Conference on
Document Analysis and Recognition
(ICDAR),pp:992-996,Japan
[7] Satoshi Ono,Shigeru
Nakayama,2010, " A System for Decorating QR Code with
Facial Image Based on Interactive Evolutionary
Computation and Case-Based Reasoning " , 2nd World
Congress on Nature and Biologically Inspired Computing (
WCNBIC ) , pp:401- 406,Kagoshima,Japan
[8] LIAO
Zhao-lai, HUANG Ting-lei, WANG Rui, ZHOU Xiao-yan,2010,
"A Method of Image Analysis for QR Code
Recognition",Intelligent Computing and Integrated
Systems (ICISS), pp:250-253 , Guilin,Guangxi
下一页:基于数字电视网络可视电话的设计与实现
|
|
